IP LAYER MONITORING IN VMWARE VSPHERE – 2

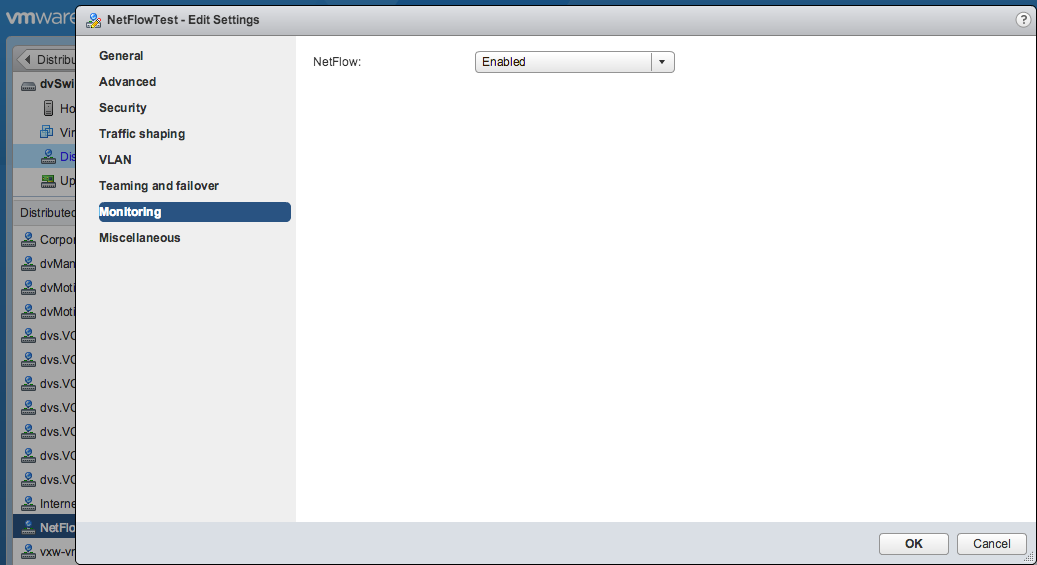
2 posts earlier, I talked about NetFlow in VMware 5.x and how to enable it in vSphere dvSwitch. I have also shown how you can send IP traffic flow information to a NetFlow collector. Nowadays, there are lots of commercial NetFlow collectors available; however, in this post I will introduce a simple, open-source NetFlow collector which you can use in your VMware environment to analyze IP traffic. This pretty piece of software is: ‘nfdump

As it’s shown, Nfdump has 2 major elements: ‘nfcapd‘ which is a daemon to gather and store relevant packets and ‘nfdump‘ which collects packets from all the daemons and interprets them. Apparently, nfcapd and nfdump could run on different machines and there could be multiple daemons but in case of VMware vSphere, it depends solely on the number of dvSwitches. If there is only one distributed switch, all the IP traffic flow information from all portgroups in that dvSwitch will be forwarded to one nfcapd. For test purposes, I also deployed both nfdump and nfcapd on a single linux machine but in cases that traffic is high, it maybe a good idea to deploy them on two different machines. Of course nfdump should have access to the storage in that case.

After installation, first you need to run daemon and specify a port and directory to store ip traffic information. Apparently, nfcapd will store information in binary. The command is simple, something like this:

  • nfcapd -w -D -l /var/netflow/dvswitch -p 23456

Then, daemon will run and listen to the specified port: 23456. If you have configured dvSwitch correctly (by specifying ip address of linux machine and 23456 as port) and activated monitoring on some portgroups in vCenter, this daemon will generate a couple of files in that directory.
Now, whenever you want to view the captured ip traffic flows, you should run nfdump. Since there are lots of files in that directory, you can interpret the whole directory using -R option with this command:

  • nfdump -R /var/netflow/dvswitch/

Filtering in nfdump is also possible, pretty much the same as tcpdump and you can view traffics of interest. You can find more information on nfdump website.

To view NetFlow captured traffic visually, you can mix nfsen with nfdump. It uses information that is dumped by daemon and utilizing rrdtool, it visualizes traffic flow. Installation is not difficult and you can see more information on their website. I’m really satisfied by this beautiful combination of nfdump and nfsen and if you intend to use NetFlow for monitoring, I recommend trying them. Good Luck!

Maintenance Plan For Databases in VMware environment

A quick note:

Maintaining database server in a VMware environment is crucial. In specific, taking regular backups is really important. Not only it helps in restoring database to a good state in emergency cases, but also it stops oversizing transaction log files. As there would be many transactions in a VMware environment, if you don’t pay attention to transaction log file, you will end up with a huge transaction log file (at least in MS SQL case) or your disk may become full and cause your whole environment to stop functioning. So, it is really important to have a maintenance plan in databases server (MS SQL or Oracle) appropriate for your environment.

DV portgroup is not found in the inventory after creation

Just for documentation that may help somebody else. The other day, I’ve got the following error when I intended to create an Organization VDC network in vCloud Director:

“Cannot deploy organization VDC network  (4a0c24d9-9f10-442b-8cb0-0fa9e8ccf0c8)
– com.vmware.ssdc.util.LMException: DV portgroup dvs.VCDVSNet1-a82df557-76db-4e37-9de3-53f4167db22c is not found in the inventory after creation
– DV portgroup dvs.VCDVSNet1-a82df557-76db-4e37-9de3-53f4167db22c is not found in the inventory after creation”

Normally vShield manager is the first thing I would suspect, but in this case it wasn’t the cause. I looked into many things and everything seemed normal. By the way, vCD Director is a software solution and unexpected things may happen. I thought restarting vCloud Director service is a good idea and yes, it worked! Therefore, the solution for me was running this command in vCloud Director server:

service vmware-vcd restart

Of course it may not fix the issue in your case. If it doesn’t help, look into VCD Cells page in cloud administrator console to see if there is an error message that maybe useful. Also, reconnecting vCenter is recommended.

p.s – VMware technical support told me to look into vCenter to monitor its CPU and memory usage. That’s a good point to be considered if everything else is okay and it’s not a configuration issue I believe. Also, database server may be slow not being able to return the result of a query in an acceptable time.

IP Layer Monitoring in VMware vSphere – 1

Following my last post about administration and monitoring tasks in VMware 5, I will talk about another promising feature of VMware vSphere 5.x: supporting NetFlow. NetFlow is a network protocol developed by Cisco for collecting IP traffic information. NetFlow has become an industry standard for traffic monitoring.
As I wrote earlier, cloud/network engineers would like to have the same capabilities in virtualization as they have in physical networks and nowadays NetFlow is turning out to be the new trend in producing networking devices such as switches. In the same way switches support NetFlow, VMware implemented NetFlow that can be enabled on vSwitches, specifically very useful in Distributed switches. Good to mention that from version 5.1 VMware also supports newer version of NetFlow which is IPFIX.  You can find more information about NetFlow by itself on the internet.
Configuring NetFlow in VMware vSphere is a 2 step process:

  1. Configure NetFlow properties on the dvSwitch.

    Hints:
    – Port is a UDP port which NetFlow collector will listen on. In NFDUMP, it is 23456! by default.
    – Of course, IP session between dvSwitch and NetFlow collector should be established in a proper way. I mean dvSwitch should see NetFlow collector.

  2. Enable NetFlow on the specific dvPort group.netflow

That’s it. In the next post, I will show how you can use a free, simple NetFlow Analyzer (nfdump, nfsen) to gather and display information about IP traffic flows in your dvSwitch.

Deploying IDS in VMware vSphere

As a network or cloud administrator in VMware environment, we would like to have the same capabilities we’ve got in a physical network. One of the most important tasks is network traffic monitoring and inspection control. Let’s say you want to install a network Intrusion Detection System (like SNORT) to monitor the traffic of a specific Virtual Data Center in vCloud environment that is translated to monitoring a specific VLAN or port group in VMware vSphere. Fortunately, VMware 5.x provides these features but apparently implementing these features is beyond VMware vCloud Director operations and it’s part of infrastructure administration tasks introduced in vSphere 5.x.
Since normally there is a port group in Distributed Virtual Switch defined by vCloud Director for each virtual data center, let’s talk about port groups in VDS. You may have noticed that when you want to create a port group in a distributed switch, you can define some security policy and one of the policies is enabling ‘Promiscuous Mode’. This is exactly equivalent to enabling promiscuous mode in a physical switch. So, as shown in the following picture, a port group can be edited to enable this mode (in vSphere Web client).

promisc

The only concern is that promiscuous mode should be defined on a port group or the whole distributed switch and not on a particular port. Doing this will cause all the traffic to be forwarded to all of the VM’s in that port group! and apparently it’s a security risk because we would like to forward the traffic to only one specific VM (port) which is our IDS. A work-around here would be to define a new port group with the same VLAN ID of the port group/VLAN we would like to monitor with the exact same configuration, then enable promiscuous mode for this newly defined port group and place the IDS VM in this port group. Because VLAN ID is the same, only IDS VM would see all the traffic. That’s an easy trick! BUT I don’t know how this trick works in some vCloud port groups that use VCDNI-backed port groups instead of VLAN-backed network pools because as I understood, VCDNI is kind of encapsulation introduced by vCloud Director and I’m not sure if a port group that is created inside vCenter can decapsulate packets. I didn’t find enough information, so I will test this out and report it in this blog.

Another approach is to use Port Mirroring feature of a VDS. Using this method it’s possible to specify source ports which need to be monitored and destination port/ports where IDS is located.

This solution is explained in detail in the following link:

vSphere 5.1 – VDS Feature Enhancements – Port Mirroring